
 Tiếng Việt
 简体中文
 Deutsch
 日本語
 한국어
 ไทย
 Русский
 Français


QUANGANHCONS | REFERENCE CONFIGURATION
1,000 kWp Solar: equipment and EPC scope before pricing
This option helps factories and industrial electrical installations with an existing MSB or 22/0.4 kV supply understand the PV arrangement, required calculations, installation scope and estimate limitations. It is not an approved design, a formal quotation or a verified completed project.
Configuration summary dated 02 Nov 2026; review status 04 Nov 2026. EPC selling prices require verification against the equipment and site conditions.
1. Who should consider this 1,000 kWp Solar configuration?
The 1 MWp array with 7 inverters totalling 875 kW AC has a DC/AC ratio of approximately 1.143. Verify power at the PCC, switchboard configuration, transformer capacity and protection against the actual connection design. This capacity class supports preliminary planning and is not an optimum for every site. Actual demand profiles, roof dimensions and the connection point may change module and inverter counts, cable quantities and installation scope.
PV generates most strongly during sunny periods. If demand is not simultaneous, surplus energy, export limits and storage must be assessed separately. Consider holidays, production shifts, shading and maintenance rather than investing solely on the capacity label.
2. Known technical configuration and data to finalise
| Parameter | Reference information | Required verification |
|---|---|---|
| PV capacity class | 1,000 kWp capacity class; actual installation 1000.32 kWp DC | Do not equate a capacity class with final design capacity |
| PV module | 1563 × 640 Wp = 1000.32 kWp DC | Confirm manufacturer/model, Voc, Vmp, Isc, dimensions and certificates |
| Inverter | 7 units, 875 kW AC total; model under review | Exact datasheet revision, MPPT count and permitted string arrangement |
| DC/AC ratio | 1.1432 times | Inverter DC limits, clipping and site-specific generation |
| Operating mode | Grid-connected self-consumption without BESS | Connection point, surplus control and permitted operating conditions |
| BESS | Not included in this PV option | Confirm whether the owner needs future expansion |
3. Electrical formulas and substituted configuration values
Actual DC nameplate capacity
Substitution: 1563 × 640 / 1,000 = 1000.32 kWp DC.
Inverter capacity and DC/AC ratio
Substitution: 1000.32 / 875 = 1.1432 times.
Module surface area and usable roof area
Substitution with an example module measuring 2.382 × 1.134 m: 1563 × 2.382 × 1.134 ≈ 4221.96 m² of module surface. Actual roof area must also allow for clearances, maintenance access, walkways and shading exclusion zones. This area calculation does not certify the roof’s structural capacity.
Indicative AC current for checking the electrical arrangement
Select circuit breakers and cables using manufacturer Imax, corrected Iz, installation conditions, voltage drop and prospective short-circuit current. This preliminary current is not sufficient on its own for procurement.
Direct PV energy against demand
At each time step, direct PV energy is calculated as Eself = Σ min(PPV,AC(t), Pload(t)) × Δt. Savings calculations require hourly demand and simulated generation based on site irradiance. Do not multiply all PV generation by a single retail electricity rate.
4. Roof, cables, protection and point of connection
Roof documentation
Zone module placement and cable routes across the roofs. Assess loading, wind, anchors, access, weatherproofing, installation safety and monitoring for each area.
DC/AC electrical work
Check the supply SLD, any 22/0.4 kV transformer, MSB sections, ACB/MCCB ratings, short-circuit current, protection, zero-export control and the network operator’s connection procedures.
Route DC cables by string/MPPT and check insulation, polarity, cold open-circuit voltage and hot operating Vmp. Confirm grouping and temperature factors, installation method, voltage drop and earthing/protection for AC routes. Without measured routes, cable lengths are budget assumptions, not as-built quantities.
Operation and energy
Model 15-minute demand, production shutdowns and time-of-use tariffs. Calculate direct PV use, surplus, curtailment and losses separately. Benefits cannot be guaranteed without actual data.
5. Scope items for the complete EPC BOQ
The following table is scope checklist for detailed take-off, rather than a priced estimate or an approved BOQ for this configuration. Once a calculation snapshot has passed review, it must provide the actual material lines, unit selling prices and totals from the engine.
| EPC group | Known information / calculation requirements |
|---|---|
| Module PV | 1563 modules rated 640 Wp in the summary; confirm model and warranty |
| Inverter/PCS | 7 PV inverters, 875 kW AC; check MPPT/firmware and protective switchboards |
| Roof mounting structure/anchors | Select for the actual roof type, structure, wind loading and weatherproofing solution |
| DC cables, connectors and SPDs | Quantities follow string counts and actual routes, including suitable accessories and protection |
| AC/MSB switchboards and AC cables | Switching, protection and PCC metering; check voltage drop and breaking capacity |
| Earthing/lightning protection and communications | Connection points, PE continuity, SPDs, logger/EMS and monitoring as configured |
| Labour, transport and lifting equipment | Quantities depend on the site, distances, access and installation duration |
| Testing, acceptance and as-built documentation | DC/AC, equipment and protection checks, trial operation and handover records |
| Excluded scope | State exclusions explicitly, including roof reinforcement, MSB/transformer modifications, third-party review fees and work outside the contract |
6. Implementation schedule and acceptance conditions
A real project schedule needs a WBS, durations, resources, FS/SS dependencies and approval milestones. The usual sequence is survey/demand measurement → confirm SLD/structure → procurement → roof/site safety → module/cable/switchboard installation → testing → handover. Procurement and approvals may run in parallel. Do not commit to durations from a reference estimate until site conditions are defined.
- Before installation: check drawings, weatherproofing details, exact model catalogues, work-at-height safety and electrical isolation.
- Before energisation: check string polarity, open-circuit voltage, insulation, earthing, AC/DC continuity, protection settings and export-limiting status.
- Before handover: as-built records, testing/energisation records, monitoring configuration, maintenance instructions and equipment warranties.
Indicative implementation schedule
101 working days under the baseline for estimate QAC-SOL-EST-20261104-5E86934A. Day 1 starts when scope and implementation conditions are agreed. Monday-Saturday, Sundays off; 8 hours/day. Public holidays, outage windows and actual delivery delays are not deducted.
Scroll horizontally to see every task, duration, FS relationship and the complete timeline bars.
| WBS | Task | Working days | Start | Finish | Predecessors (FS) | Planned resources | Timeline: day 1 → 101 |
|---|---|---|---|---|---|---|---|
| 1 | Survey, scope confirmation and roof data | 7 | Day 1 | Day 7 | — | As defined in the method statement/package |
|
| 2 | Design, coordination and material approval | 6 | Day 8 | Day 13 | 1 | As defined in the method statement/package |
|
| 3 | Awaiting grid-connection / owner confirmation | 20 | Day 14 | Day 33 | 2 | As defined in the method statement/package |
|
| 4 | Procurement, fabrication and delivery | 30 | Day 14 | Day 43 | 2 | As defined in the method statement/package |
|
| 5 | Mobilisation and site preparation | 2 | Day 44 | Day 45 | 3, 4 | As defined in the method statement/package |
|
| 6 | Frames, modules, cable trays and walkways | 29 | Day 46 | Day 74 | 5 | As defined in the method statement/package |
|
| 7 | Cable installation, terminations, switchboards and earthing | 19 | Day 75 | Day 93 | 6 | Electrical crew of 5 |
|
| 8 | Testing, commissioning and acceptance | 5 | Day 94 | Day 98 | 7 | As defined in the method statement/package |
|
| 9 | As-built records, handover and site clearance | 3 | Day 99 | Day 101 | 8 | As defined in the method statement/package |
|
Brown: tasks on the baseline critical path. Green: tasks with float. FS means the preceding task finishes before the next starts. Confirm the schedule and crews after the survey, material approval and supply arrangements.
1000 kWp Solar estimate – view and download
Estimate reference: QAC-SOL-EST-20261104-5E86934A · Calculation source: QAC Solar 8.21.0 · Status: Preliminary pre-survey budget.
Before VAT: VND 12,003,840,000 · Scenario VAT: VND 1,200,384,000 · After VAT: VND 13,204,224,000.
Open 1000 kWp estimate PDF Download PDF Download BOQ Excel
If the PDF does not appear in the embedded viewer on your phone, select open the PDF full screen. The PDF and Excel share the same calculation reference. Do not substitute pricing from another system capacity. Equipment purchase prices, legally applicable VAT and site-specific scope must be verified before signing a contract.
12-month generation – simulation for the 1000.32 kWp DC PV system
Illustrative scenario, not measurements from the project: Ho Chi Minh City (10.8231°N; 106.6297°E), south-facing roof at 10° tilt, using ERA5 weather for 2023 through JRC PVGIS 5.3. PVGIS system-loss input 14%; assumed AC limit 875 kW. These figures are not a generation guarantee.
Total available PV energy in the model window: 1352129.78 kWh. Self-consumption and curtailed surplus use assumed demand and a zero-export scenario. These figures are not meter readings.
On a phone, scroll the table horizontally to read every column for all 12 months.
| Month | Available PV (kWh) | Direct PV consumption (kWh) | Curtailed PV surplus (kWh) | Assumed demand (kWh) |
|---|---|---|---|---|
| 1 | 104006.81 | 93203.15 | 10803.66 | 295787.50 |
| 2 | 120406.36 | 107340.60 | 13065.76 | 271020.00 |
| 3 | 140362.73 | 126590.26 | 13772.47 | 303457.50 |
| 4 | 127134.10 | 112550.98 | 14583.12 | 284712.50 |
| 5 | 117848.53 | 109384.08 | 8464.45 | 303457.50 |
| 6 | 102452.98 | 94098.86 | 8354.12 | 292645.00 |
| 7 | 96199.48 | 88758.61 | 7440.88 | 295525.00 |
| 8 | 119353.43 | 109327.63 | 10025.80 | 303457.50 |
| 9 | 97036.47 | 90016.33 | 7020.14 | 292645.00 |
| 10 | 106938.15 | 96480.06 | 10458.09 | 295525.00 |
| 11 | 105280.93 | 94825.37 | 10455.56 | 292645.00 |
| 12 | 115109.80 | 103791.81 | 11317.99 | 295525.00 |
24-hour representative daily curve – 15 Mar 2023
Assumed demand used in the calculation (24 hourly values)
Base load 120.00 kW; daytime load 850.00 kW; evening load 200.00 kW. Operation is Monday-Saturday; Sunday remains at base load.
00-05 and 22-23: base load; 06-07: 45% of daytime load; 08-11 and 13-17: daytime load; hour 12: 75% of daytime load; 18-21: evening load. This simulation assumption must be replaced with metered demand profiles during design.
| Hour (UTC+7) | PV power (kW) | Demand (kW) | Direct PV consumption (kW) |
|---|---|---|---|
| 00:00 | 0.000 | 120.000 | 0.000 |
| 01:00 | 0.000 | 120.000 | 0.000 |
| 02:00 | 0.000 | 120.000 | 0.000 |
| 03:00 | 0.000 | 120.000 | 0.000 |
| 04:00 | 0.000 | 120.000 | 0.000 |
| 05:00 | 0.000 | 120.000 | 0.000 |
| 06:00 | 30.450 | 382.500 | 30.450 |
| 07:00 | 224.092 | 382.500 | 224.092 |
| 08:00 | 404.920 | 850.000 | 404.920 |
| 09:00 | 568.912 | 850.000 | 568.912 |
| 10:00 | 653.509 | 850.000 | 653.509 |
| 11:00 | 692.562 | 850.000 | 692.562 |
| 12:00 | 685.409 | 637.500 | 637.500 |
| 13:00 | 436.740 | 850.000 | 436.740 |
| 14:00 | 377.771 | 850.000 | 377.771 |
| 15:00 | 285.441 | 850.000 | 285.441 |
| 16:00 | 168.424 | 850.000 | 168.424 |
| 17:00 | 38.422 | 850.000 | 38.422 |
| 18:00 | 0.000 | 200.000 | 0.000 |
| 19:00 | 0.000 | 200.000 | 0.000 |
| 20:00 | 0.000 | 200.000 | 0.000 |
| 21:00 | 0.000 | 200.000 | 0.000 |
| 22:00 | 0.000 | 120.000 | 0.000 |
| 23:00 | 0.000 | 120.000 | 0.000 |
Calculation method, formulas and simulation limitations
For a time step Δt = 1 hour: PPV(t) = min[max(PPVGIS(t)/1,000, 0), PAC]; Pself(t) = min[PPV(t), Pload(t)]; Emonth = ∑ P(t) × Δt. Surplus power expected to be curtailed under zero export: Psurplus = max(PPV − Pself, 0).
Example at 11:00 on 15 Mar 2023: Pself = min(692.562; 850.000) = 692.562 kW; direct PV energy in this hourly step = 692.562 × 1 = 692.562 kWh.
The source contains 8,760 hourly power values. The 14% loss input was applied once in PVGIS; do not multiply by another PR. Site shading, string/MPPT configuration and actual demand schedules have not been checked. View PVGIS simulation inputs for the 1000.32 kWp DC configuration.
8. Equipment and PV installation images
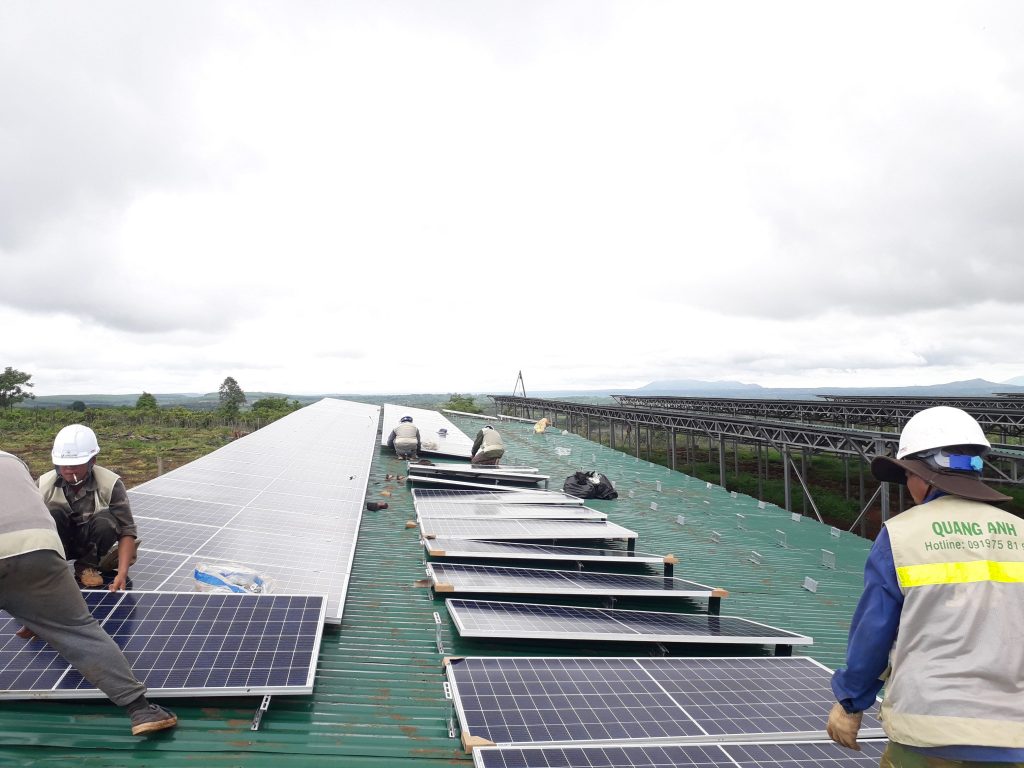
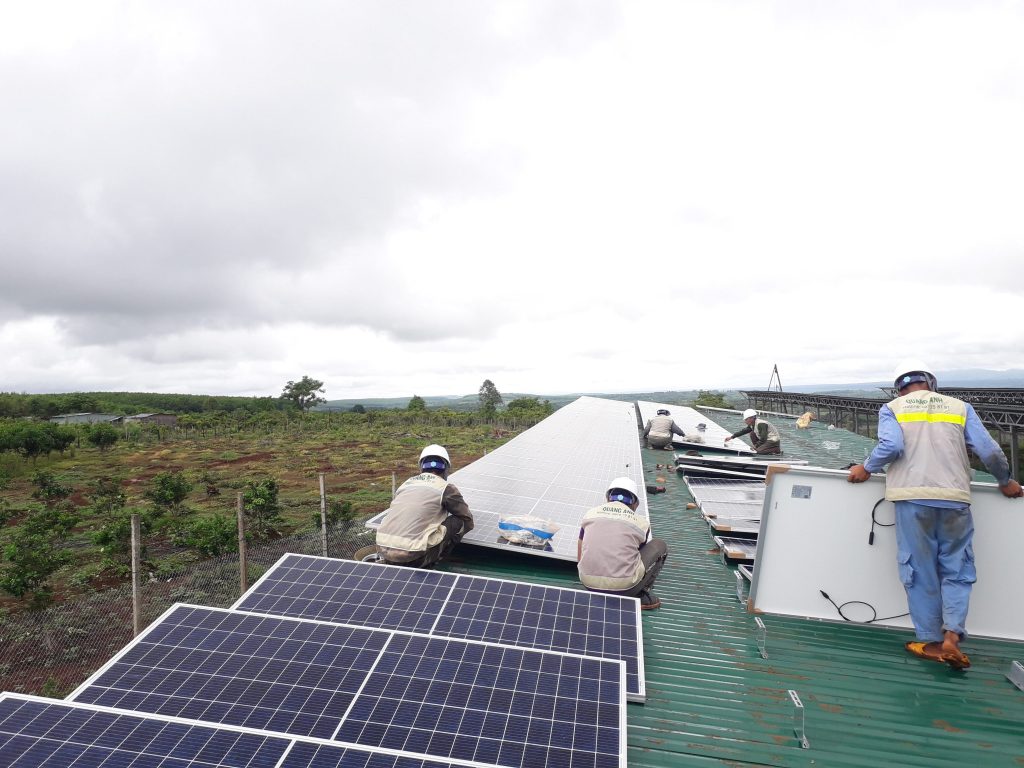

These library images illustrate roof layout and PV installation work. They are not evidence that this particular 1,000 kWp reference system has been constructed unless project records confirm it.
9. Standards, regulations and actions for this configuration
The references below were reviewed on 05 Nov 2026. They include Decree 58/2025, as amended by Decree 243/2026, current electrical-safety regulations and fire-safety requirements for the building type. Applicable procedures depend on the connection diagram, responsible entity and operating mode; they cannot be inferred solely from the capacity label or inverter voltage. Selected standards and mandatory regulations have different scopes. This is a pre-survey reference configuration, not confirmation of compliance at a specific site.
| Legislation/standard | Applicability to this estimate |
|---|---|
| Decree 58/2025/ND-CP, as amended by Decree 243/2026/ND-CP | Identify self-generation/self-consumption arrangements and procedures for the project, responsible entity and connection point. |
| Decree 243/2026/ND-CP | Surplus-electricity provisions and related amendments. This self-consumption estimate does not assume revenue from surplus sales. |
| QCVN 25:2025/BCT; Circular 41/2025/TT-BCT | Electrical safety. Check the actual work and operating scope. |
| Decree 105/2025/ND-CP, as amended by Decree 347/2026/ND-CP | Fire-safety duties depend on building type and alterations. Storage requires a separate assessment. |
| QCVN 06:2022/BXD and Amendment 1:2023 | Fire safety for buildings and structures. Check the building type and the scope of alterations. |
| TCVN 7447-7-712:2019 | Low-voltage PV electrical installations. |
| IEC 60364-7-712:2025 | Check PV installation design against the selected edition. |
| IEC 62548-1:2023 + AMD1:2025 | PV-array design, DC wiring, protection and earthing; it does not replace the complete BESS design. |
| TCVN 11855-1:2017 | PV documentation, inspection and testing within the standard’s scope. |
| TCVN 2737:2023 | Loading, wind and load combinations. Roofs, anchors and structures require a separate survey and calculation. |
Before implementation, finalise the connection diagram, roof/anchor/wind checks, protection coordination, fire-safety scope and applicable notification/registration or other procedures. A list of standards alone does not certify that the configuration meets every requirement of a particular project.
Read the connection and surplus-electricity sale conditions.
10. Frequently asked questions
Does 1 MWp DC mean 1 MW AC is exported to the grid?
No. This summary configuration totals 875 kW AC at the inverters. Actual output also depends on efficiency, control and grid conditions.
Can this 1,000 kWp EPC price already be used to place an order?
No. Quantities and pricing must be recalculated from site inputs, with confirmed models and valid quotations. The earlier summary is not an approved sales offer.
Can the kWp rating directly predict annual kWh generation?
No. Generation depends on location, irradiance, temperature, roof angle, shading, efficiency and export limits. Use a model suited to the site’s data.
What files are included in the EPC documentation?
After QA, each calculation is locked to a snapshot reference with an online detailed BOQ, customer quotation PDF, itemised Excel with unit prices, substituted calculations, Gantt schedule and conditions/exclusions. The files share the same data and are checked before release.
Installation video and equipment documents
Solar installation material presented by QuangAnhcons illustrates construction work. It does not represent this 1000 kWp reference system.
Configuration comparison and supporting sources
Cross-check datasheet LONGi 640 Wp and Sungrow inverter documents for the exact models in the estimate. Check DC strings/MPPT, standards and connection requirements before preparing the installation design.
Try another Solar option
Enter capacity, roof type and storage requirements to view a separate indicative estimate.
Reference: Full Solar calculator · BESS estimate · Substation cost (on a dedicated page).